Monday 24 September 2012

And Finally: Quarterlies. Accessing Quarterly XBRL in Excel

A bit later than planned but finally you can now select XBRL 10Q filing data in XBRL to XL and analyse it in Excel.

I have created a new template for quarterly data, which automatically gets selected for download if the 1st filing you choose is a 10Q. This has been designed to make the most of both the values for the most recent quarter and the Year To Date (YTD) numbers.

In a quarterly report, a company will in effect report 5 periods worth of data: latest & previous quarter; latest YTD & previous YTD and comparable balance sheet numbers for the start of the year to which the quarter belongs. In the 1st quarter 10Q, the YTD's won't appear.

So in an XBRL quarterly filing, there are in theory up to 5 principal periods but XBRL has two types of concept (or context to use the XBRL parlance) for any given period: one for duration elements (e.g. income statement items) and one for instant elements (e.g. balance sheet items) so that might lead you to think that a quarterly filing has 10 of these things, except that it doesn't because a quarter and a corresponding YTD share the same instant balance sheet date.

This makes lining up periods for comparison tricky. especially the latest YTD which shares the same balance sheet numbers as the quarter. In XBRL to XL, we have duplicated these numbers to create fully comparable columns of data, regardless of whether you are looking at quarter or YTD figures.


In the "Filing" sheets (above), containing the data laid out as it appears in the filed document, 5 columns of data are downloaded: latest & previous quarter; start of year balance sheet; latest & previous YTD. Be aware that generally, no comparable balance sheet figures are included for the previous quarter - you will need to include the filing for the previous quarter for that.

And in the "Standard" sheet, we have created a new control allowing you to toggle between the quarter and YTD values.


Set it to true to see the YTD numbers.


"Control" is a rather over blown description for it - it's just a cell in which you type either true or false! And the item value formulas use this to determine which columns to use in the calculation.

Friday 7 September 2012

Comparing XBRL: What happened to Step 1?

If you read my last post, you might be wondering what happened to Step 1! Well Step 1 in comparing XBRL is about actually accessing the stuff in the first place in a way that enables you to do comparisons, which is what I've been droning on about in most of my previous posts and what XBRL to XL is all about.

So it would be a bit rubbish if you couldn't actually access all the data, like in XBRL to XL where you can't currently download quarterlies. So rubbish in fact it's time to change this. As from Monday quarterly data will be available and I will talk here about the issues of accessing quarterly data in XBRL and how we have combated them to maximise comparability and transparency.

Wednesday 5 September 2012

Comparing XBRL - Step 2: Standardisation

As I may have said before, when a company prepares a financial report, it's principal aim is not to create comparable data but a narrative that best explains its financial position and its potential for changing it. XBRL helps to close the comparability gap but this isn't a guarantee or automatic.

So a company in it's use of XBRL may well create a coherent financial view but not necessarily a complete one. In other words if you tried to fit the data to a standard chart, there might (and probably will) be gaps.


This is how revenue is standardised in XBRL to XL. You can see that Microsoft discloses a figure in XBRL for sales revenue but Oracle doesn't. Oracle does disclose a figure for (total) revenues but Microsoft don't! In fact Oracle disclose all sorts of revenue figures...


So how do you compare revenues for both companies? Well XBRL to XL at the moment does this in a rather clumsy way - it creates it's own comparative total (Total Revenues) which it does by adding up all the things it thinks is revenue as an Excel formula. Now for this formula to be truly complete it would need to include all the following items....


In fact that's not all of them, that's not even a third of them. That's only the ones I could fit in my screen shot whilst zooming out as far as I dare.

The issue of standardisation I'm sure is an issue that will be discussed at length at the data forum in next weeks national XBRL US conference in Austin, Texas.

It even gets it's own webinar - Standardizing XBRL a week later. So it must be on somebodies mind. It certainly is mine as will become clear in future instalments.

I'll be at the conference so if you see me, please say Hi. I even have a stand - Woooh! - well more of a table.

Wednesday 15 February 2012

Instant comparisons of XBRL data in Excel

You want to compare 5 companies using your own unique, highly sophisticated model in Excel. No problem - just visit xbrlxl.com, click the "XBRL to XL" button, select the companies, choose your filings & click the "XBRL to XL" button again. You will then have a spreadsheet on your desktop crammed full of XBRL data ready for Analysis.

(Update: You can now access this data directly from Excel using XBRL Sheet)

Why is it Analyst ready?

1. It comes with the tags so cross-company comparisons are possible.

2. The data is wholly transparent - miraculously the data arrives in Excel just as it appears in the tables of a 10-K or 10-Q document yet through the power of Excel, any XBRL data item can be called up for use in creating standard formulas. Of course this link can be traced back to show in effect where in the original report your normalised data came from. More than that it shows you if any of the data items used by the company are not standard (potentially compromising any comparisons - something that is not visible in the original financial reports).

3. It's "readily" customisable - You choose the years & data items you wish to use. What you can then do with the data is limited only by the near unlimited power of Excel and it's sister applications in Office.

Right that's the sales pitch out of the way! In my previous post I looked at how you could hook up XBRL to a financial model in Excel. I used an Arelle Fact Table from the Arelle GUI as the source but wondered whether this could be made much, much simpler. XBRL to XL is the result of my musings.

XBRL to XL is very easy to use. There are only 2 types of button you need to worry about. The 5 filing buttons and the magic "XBRL to XL" button so 6 in all. So when you have filled in the search fields for your 1st filing, you press the "Filing 1" button. When you want to search for your 2nd filing you press the "Filing 2" button and so on. This is the only thing you really need to remember as if you press the top button ("Filing 1") when you were actually trying to select the 3rd filing, it will replace the details of the 1st filing rather than put them in the 3rd slot.


The more specific you can be with your search criteria, the faster the search, as the filing details of the five filings will be automatically populated in the filing selection box ready for processing. If you know exactly which filings to include, the whole process will take no more than seven clicks (one to select each filing, one for XBRL to XL to do it's thing and one to confirm your download.

The same 5 "Filing" buttons are used if your initial search has not been specific enough and you need to select a company and/or a particular filing. Click on the check box of the particular company/filing you wish to select and then press one of the 5 filing buttons again, depending in which sheet you wish it to appear. You can keep replacing filings in the filing selection box using the filing buttons until you are happy with your choices.

Note these filings can be from 5 different companies or 5 historical filings from the same company or a mixture. There are no restrictions.

Now press the "XBRL to XL" button to get your filings to Excel. XBRL to XL goes and gets the required filings from the SEC and processes the data into Excel. The processing stage for each filing is highly optimised and takes approximately 2 seconds per filing plus the time it takes to retrieve the XBRL instance documents from the SEC.

Once processing has been completed, you can choose to download the spreadsheet or a zipped version. The downloaded spreadsheet can have up to 5 filings of XBRL data stored in separate sheets which will automatically populate the model on the "front" sheet. The current model that is downloaded is very sparse and is there by way of example (for you to improve on!) The mechanics of how this model is connected to the XBRL data is explained in the previous post Looking up XBRL in Excel.

So there you have it - Analyst Ready data in Excel and represents my entry in the XBRL Challenge set by XBRL US. More details can be found on the fact page for my competition entry. You can also watch "XBRL to XL" TV where you will find step by step guides to downloading and using the data.


Thursday 12 January 2012

Looking up XBRL in Excel

This post follows on from previous one - Xbrl Comparative Analysis in Excel. And I have now created two easier ways of getting XBRL into Excel using XBRL to XL and XBRL Sheet.

When building a standard model to represent XBRL data what do we need to be thinking about?

Well my thinking is that we need to use formulas which are:

1. Easy to build
2. Replicable
3. Transparent

And the model needs to be:

4. Re-usable for different entities.

This really has very little to do with XBRL but an awful lot to do with building robust, validatory & maintainable models.


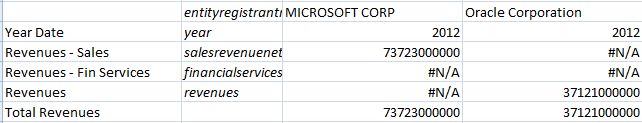
1. Easy to build. We don't want to be spending more time than it's worth building a beautiful model. So we need a standard formula (see above). At a minimum, this formula must reference three components: the relevant data item (e.g. us-gaap:SalesRevenueNet); the entity (e.g. Microsoft); the time period or instant (e.g. 30th June 2011).


Given that each XBRL tag has to be unique and that there are nearly 16,000! of them, their names tend to be long and extremely forgettable so the quickest way to reference a data item is going to be from a handy list. Again Excel is very good at lists so I'd recommend building a list of the items you are most likely to use in a separate sheet (see above), each tagged with a memorable short name (a tag tagging a tag - whatever next!). You can download the US-GAAP taxonomies from XBRL US which you can then load up in Arelle to use as a starting point. Visit Charles Hoffman's blog for more accessible versions and to learn how to navigate around these monsters.

You can then lookup the item you wish to use from your list when building a formula (either by manually selecting the cell or using yet another lookup function). Of course, if you are that way inclined, you can always build a VBA function to do this but I try to avoid these when I can, as they can create clarity, mobility & version issues that then means your model stops working when you least want it to!


As I mentioned in my previous post, it's a good idea to put each company in a separate sheet (see above) so each column references a particular sheet. You need to set this reference up in each column. I made this easy to do by naming each sheet with it's ticker so we just need to add this to each column and then use this cell in each formula. We can even make this automatic which I will come onto when (and if!) I get to point 4. I have created a fixed range "A1:E1000" for each sheet in the standard lookup formula. Potentially this might get exceeded so you need to keep an eye on this when you load new companies. We could get cleverer with this and make it self managing but I'm realising that this post is already ridiculously long! so I'm not.


We can take advantage of our knowledge of how we loaded the data from Arelle into separate sheets to gain some control over which period will appear in each column. We know the latest year of data will be column 5 (see above). So when we use a lookup function, we can specify a year relative to this (also see above). In forecasting models, the last reported year is often regarded as the current year or year "0". Although strictly speaking it isn't. That honour really belongs to the 1st year to be forecast, which is the current financial year but which is actually referred to as year "1". Still with me!? I have adopted this nomenclature in the way we specify the relative year so year "-1" is the year previous to the latest reported year. Things get way more complicated when we try to create composite years but that's a post much further down the line.

The long and short of this is that it's very easy to specify which year you want to see in each column of your model - enter a number relative to the latest year in the relative year row.

So you take the standard lookup formula, choose a data item from a list and put it in the 1st (or data item) column then set the ticker and relative year you want for each column. Simple.

2. Replicable. Now if you've put your dollars ($) in the right place (which I think I have!), you only need to create the formula once and you can copy it all over the spreadsheet and it will work. Phew! point 2 was a hell of a lot shorter than point 1.

3. Transparent. In my standard items and in my ratios, I want to know where my data is coming from so when I get a surprising value, that surprise doesn't last long! With this in mind, I would recommend that each standard item consists of one XBRL item and that this sheet is then in effect just an intermediary layer or step to your analytics. This may seem over-elaborate but trust me - this will save you an awful lot of time in the future. If you want "robust, validatory & maintainable", there is a price. We can do an awful lot more on this and I will in the future because this is important and really is my "value-add".

4. Re-usable. At some point I'm probably going to get bored of analysing Microsoft and Apple and it might even start to dawn on me that Apple will not remain a perpetual money making machine for ever so I'm gonna need some new companies, perhaps even a new model. So I bin my spreadsheet.......No wait - you don't need to - the "back end" will remain valid. You may need to add some new items to the standard layer for your new "front end" analytical model to work but as you've seen above, that's easy. It will be even easier if you do what I've done with my third example.


Each seperate sheet (see above) is now called filing (1), filing (2) etc. So now you can wipe the existing XBRL and load the new data into each respective sheet without having to re-name it. I've used the word "filing" rather than "company" or "entity" as you may wish to re-use this same sheet to do some historical analysis going back across multiple periods and hence multiple filings. This poses no problems whatsoever and you can even flick the relative year between "0" & "-1" depending on whether you wish to use restated data or not.

You maybe wondering why I've put the numbers in brackets rather than say "_1". Well as you may have noticed by now, I'm quite lazy and this fools Excel into thinking that these are duplicate sheet names, which means each time you copy the last sheet, it automatically re-names it incrementing the number inside the brackets by 1 so I don't have to! I don't know why anyone would want to use any other analytical tool - it's a slackers paradise!

Now if only we could simplify the process of getting the raw XBRL data into the spreadsheet in the first place......Ummm, guess what, I might have an idea on that. Stay tuned!

The examples used in this post are available for download from my website (follow the "Spreadsheet Examples" link. Enjoy building your models!

Friday 6 January 2012

XBRL Comparative Analysis in Excel using the Arelle Fact Table as a source

It's a bit messy and requires you to tidy the data but because the Arelle GUI exposes the XBRL tags with their respective values (see "Xbrl Tags into Excel using Arelle" post), we can harness the power of Excel to finally do what XBRL was supposed to allow us to do in the first place - compare companies.

Five simple steps required for each company you wish to compare.

Step 1 - Load instance document. Arelle allows you to load this directly from the web if you don't feel the need to download and store it locally.


Choose "Open Web..." from the File menu and copy the URL of the instance document into the input box (shown above). There are two ways to find this - the slow way & the quick way. The slow way requires you to click on the "SEC Search" button which takes you to the EDGAR search page, find the company you are looking for, search for the filing etc etc etc.......You may find it quicker to use the "single click" search option available from my website (see post "Easy access to SEC XBRL spreadsheets via a web app").


From my website, enter the company identifier or name, make your single click to search, then right click on the "X" (shown above) for the filing you require and choose to copy the link. Return to Arelle & paste into the input box. Crikey all this just to open an instance document! and that was the easy bit!

Step 2 - Copy the "Fact Table" to Excel. First remove all (well some) of the unwanted (empty) columns. Choose the remove random empty columns option otherwise known as right clicking on the table and choosing "options > ignore dimensions". For more on this, see previous post "Xbrl Tags into Excel using Arelle".

Step 3 - This step isn't entirely necessary but it kinda feels right (and should speed up lookups - see below). Delete all the note sections containing html formatted and therefore difficult to read text by deleting the rows containing this data.

Step 4 - Delete the unwanted columns that the "random" button failed to delete (i.e. most of them). You may need to expand the width of the columns to see which one is which. Don't use the "autofit column width" option to do this quickly as you will end up with some flipping big columns which are then difficult to re-size back to something sensible! Highlight all the columns and set the width manually to something manageable instead. I deleted 19 columns for the Microsoft 10K in the example spreadsheet (see below) to leave me with the 3 key years of data.


Now you in effect have a lookup table with 2 years of balance sheet (or "instance" data in XBRL parlance) and 3 years of "duration" data such as the income statement.

Step 5 - Except lookups won't work because an exact match is needed for unsorted data (would need to be in alpha-numeric order for it to be sorted) and the tags pasted from Arelle have leading spaces consistent with the presentation hierarchy, so another step is needed. Insert a new column in front of the tags and fill it with the following formula "=trim(B1)" using a relative cell reference to replicate the "tags" column but with the leading spaces removed (as shown above).

Now do it all over again for the next company you wish to compare! putting it in a new sheet.

Because the tags are the same* regardless of which company you are looking at, you can now use Excel's lookup functions to create standard reports for comparative analysis. Order is unimportant for exact lookup functions, which is what enables us to do this regardless of how the company has chosen to present the data.


The beauty of this is that you can load the data "as presented" whilst viewing the data in a standardised format customised to your choice. Standardised and as presented data connected and all in the same file. Now that is powerful and only possible because of XBRL. More on the mechanics of how to create a standard report for multiple companies in my next post. For now have a look at the example spreadsheet (snippets above) which you can download from my website - www.xbrlxl.com (follow the "Spreadsheet Examples" link on the left hand side).

*Unless a company has made excessive and unnecessary use of the dreaded taxonomy extensions.