In my last post The SEC Structured Data Sets, I talked a little about this new SEC initiative to make XBRL more accessible. This time I'm gonna major on how it works.
At this point you may want to refer to the SEC technical document Annual and Quarterly Financial Statements, the Financial Statement Data Sets page (where the files reside) and if you want to see what the data contained in these files actually looks like, you can download one of our example spreadsheets here. The web queries in this sheet access XBRL Flat, our name for this data set. The sheet itself contains links to videos & info on how it all works. I will talk more about our item for item implementation of this data set in my next post.
On the Financial Statement Data Sets page, you will see there are currently 24 files. After we pass the last business day of this quarter (March 31 2015), they'll be 25. Don't try to open the latest files in Excel - they're too big but you could download one of the early ones to take a peak at the data layout of the files contained in these zips.
As the comprehensive technical document explains, there are 4 files. The one that counts is the num.txt. This has the values. In theory this file by itself has enough in it to do your analysis - values matched with dates and most importantly, tags for each filing. The files are not cumulative so you need to access each one to be sure of finding your filing. This is the point, in other words, where you need to load all these files into a database. If you load it all, its gonna be big (over 10 gig for starters).
The filings are keyed on the Accession Number (adsh) which is what EDGAR uses, so if you want to find the values for a particular company, you need to look up the adsh. This is where the sum.txt file comes in, which contains the company names & CIK's, so you need to load this into another table. Of course you could just find the adsh by going to EDGAR or our website - if you select a filing from xbrlxl.com, the adsh corresponds to what the aNo = in the address bar, but the adsh adds some annoying dashes! (In our implementation, we use a more comprehensive and timely database for these lookups - this is what you see at xbrxl.com).
You could stop there, as for example all the values we download in XBRL Flat come from just these two files. But if you want to see what the company has called these data items and if like us, you are sticklers for as reported data, then pre.txt contains the layout along with the labels. The final file, tag.txt contains important information on the tags but you may consider it not important enough.
So what to watch out for? Duplicate values! - surely impossible but no it's been seen and verified in the original filings. And the fields aren't quite in the order shown in the documentation so use the header records. Also you may want to exclude any records where the coreg field is populated, as more than likely you ain't looking at a value for the entire consolidated entity in these cases (I anticipate this will become more prevalent and relevant when they release values for the notes).
Two small bits of standardisation have occurred in these files that are not explicitly documented.
The financial statement headings do not have standard names and tags in the US-GAAP implementation of XBRL i.e. what's in the original filings (Yes I know - ridiculous!) but they do now in this SEC data set; these names and codes (or shall we call them tags?!) are actually all listed in the technical document.
The only slight problem is that a filing can have two financial statements which bear the same code (e.g. BS). One for the consolidated group and one for the parent. Can you tell the difference? Er No. Of course the parent one should have drastically less items. But of course if I'm gonna read this with a computer, I have to go through the hassle of counting items or something and that of course is not necessarily an exhaustive solution. There is also a code called UN (Unclassifiable Statement) which suggests that the SEC classifications may not themselves be exhaustive! I don't actually know why I'm going on about this as we solve this problem (differently) in our full database.
Secondly, the month end of the dates attached to each value have been standardised. This is good and bad. Good as it makes searching and aggregating easier, unless you were specifically looking for values at Apple's year end (27th Sept 2014) when the values are held as 30th Sept. Bad as those few companies that don't adhere to standard month end periods (last Friday of the month etc) can have say 51 week or 53 week years and you wouldn't know it from the num.txt file. This could lead to say revenues being over or understated by 2% on an annual basis, more so if quarterly. To pick this up, you need to keep an eye on the period date in the sub.txt file (don't use the fye field as its filled in inconsistently - 0927 for Apple but 1130 for adobe).
Probably worth re-iterating that no additional standardisation of data values has occurred in this data set. For more details on what needs to be done, see my Missing Totals post.
Next time I will explain how we have replicated this database and what you can do with it.
Monday 23 February 2015
Wednesday 18 February 2015
The SEC Structured Data Sets - uh?
This SEC Announcment may have slipped your notice, as it was slid out at the back end of last year when certainly my thoughts were more about parties than databases. The SEC announced that some of that mountain of XBRL data that's been piling up on their computers is now available as a series of flat files. The Data Transparency Coalition certainly thought it was significant.
So what are these Structured Data Sets and what does this all mean for accessing Comparative XBRL data for financial analysis? By bulking it up and stripping out the markup they've made part of the XBRL filing data more accessible but with a number of caveats. Note I said "more accessible" and not "accessible". You can't open these files in Excel - you might think you can because they are tab separated flat files but actually you can't; they are too big. They are designed to be read into a database (from whence they come). So if you quickly just want to get hold of some tagged data for a few companies from the SEC, you're out of luck. Note you can also load the XBRL instance document into Excel as XML but that doesn't make it any more readable.
But it is now much easier to read them into an database. Yes you still need to build an intermediary database. But you don't have to worry about context references and dimensions and all that messy XML tagging. e.g. In an existing XBRL filing I might find 43 values for "Revenues" but which is actually the one I want? In the flat file, num.txt, there will probably be just 3 values - one for each of the primary financial periods.
Of course you don't have to build your own database - because we built one earlier! So if you quickly just want to get hold of some tagged data for a few companies then you can! We thought it would be an interesting exercise in evaluating the worth of this pilot program. We found it relatively easy and we like what we see. We chose to add a little pre-processing to the files, to make the resulting database run more efficiently and coalesce better with our existing ones.
Our copy can be accessed in exactly the same way as all our data - through Excel. A simple web query brings the data into a sheet according to the parameters you supply. It works just like the existing XBRL Sheet. The query is available here and the example XBRL Sheet here. You can also find a video here that shows you how to get started with the example sheet. Probably worth pointing out that because access is simply through the rendering of a customisable web page - the web query, access isn't confined to Excel; many other applications and programming languages can interface with this.
So what are the caveats? It is only data from the Financial Statements themselves that are in these files. Nothing from the Notes to Financial Statements for now and new files only appear once a quarter. And it is just as it was filed - there are no corrections in these data sets.
In the next couple of posts I'll talk more about the technical aspects, our implementation and the current limitations of this initiative.
Monday 2 February 2015
Dealing with XBRL data issues part 1 - missing totals
As can be detected from the title, there are numerous issues, many of which in reality are (or can be seen as) positive features of XBRL! I'm gonna deal with each of them one by one by demonstrating the various strategies we use to create comparative data.
I first touched on this in an earlier post and explained what was then our rather clumsy solution to the problem.
Missing totals mean missing standard values when trying to do comparative analysis. They are missing because XBRL preserves the presentation that companies have always used to show their financial performance, namely the succinct and more readable presentation you see in a paper report. Why would you want to repeat a figure just to create a complete set of totals? There's no need, it will only create clutter and make it less readable.
Fortunately we can do something about this and we do in the latest version of XBRL Sheet (the latest version is not yet generally available so email us - jimtruscott@fundamentalx.co.uk - if you would like to start using it). You can find more info on XBRL Sheet in this post and you can watch XBRL Sheet solving the missing totals problem in this video.
Lets have a look at an XBRLSheet download...

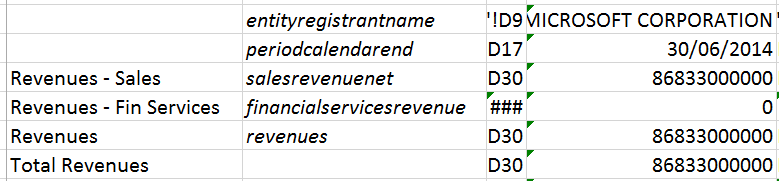
Before we used to download one column of tags, now we download two! The 1st column contains the standard tags which is our understanding of the high level tag that the company should be using in a "Standard" rendition of the values. This will usually marry up with the actual tag they used (in column 3) as per line 4 - Cost of Revenue in the example above. But if they have been more specific (which is great as more precise tags gives us a better understanding of their business), then we supply the different high level tag as well (which they haven't used as they would have to duplicate the line, creating a cluttered presentation as discussed above). So line 3 - Revenues is a case in point. Microsoft used the more specific tag "SalesRevenueNet". To make these easy to spot and check if necessary, the different standard tag will appear in a different colour. So we see another one further down. Again we may be interested in quantifying all provisions when a business is restructured rather than just goodwill. These two different tags enable us to do this.
So how do we use this info in our model? Well as we always recommend (see this post - specifically the bit about transparent data), you should connect with this data via an intermediate sheet (see below), to create values that can plug straight into your model.

Now with this extra column, we don't need to create a calculation to catch all the multiple alternatives for revenue (as represented by the Total Revenues line); we just need to use a simple lookup on "revenues" in this new column and the values will appear as shown. The 2nd column above contains the tag that is looked for. We in fact do a double lookup - we look in both tag columns in the Filings sheets to make sure we never miss an item and this also allows us to pick up the specific values if we want as well (e.g. the Revenue - Sales line). The names in the 1st column by the way are our names for the items and demonstrate how having an in-between sheet enables you to customise the data before it hits your model.
I first touched on this in an earlier post and explained what was then our rather clumsy solution to the problem.
Missing totals mean missing standard values when trying to do comparative analysis. They are missing because XBRL preserves the presentation that companies have always used to show their financial performance, namely the succinct and more readable presentation you see in a paper report. Why would you want to repeat a figure just to create a complete set of totals? There's no need, it will only create clutter and make it less readable.
Fortunately we can do something about this and we do in the latest version of XBRL Sheet (the latest version is not yet generally available so email us - jimtruscott@fundamentalx.co.uk - if you would like to start using it). You can find more info on XBRL Sheet in this post and you can watch XBRL Sheet solving the missing totals problem in this video.
Lets have a look at an XBRLSheet download...

Before we used to download one column of tags, now we download two! The 1st column contains the standard tags which is our understanding of the high level tag that the company should be using in a "Standard" rendition of the values. This will usually marry up with the actual tag they used (in column 3) as per line 4 - Cost of Revenue in the example above. But if they have been more specific (which is great as more precise tags gives us a better understanding of their business), then we supply the different high level tag as well (which they haven't used as they would have to duplicate the line, creating a cluttered presentation as discussed above). So line 3 - Revenues is a case in point. Microsoft used the more specific tag "SalesRevenueNet". To make these easy to spot and check if necessary, the different standard tag will appear in a different colour. So we see another one further down. Again we may be interested in quantifying all provisions when a business is restructured rather than just goodwill. These two different tags enable us to do this.
So how do we use this info in our model? Well as we always recommend (see this post - specifically the bit about transparent data), you should connect with this data via an intermediate sheet (see below), to create values that can plug straight into your model.
Now with this extra column, we don't need to create a calculation to catch all the multiple alternatives for revenue (as represented by the Total Revenues line); we just need to use a simple lookup on "revenues" in this new column and the values will appear as shown. The 2nd column above contains the tag that is looked for. We in fact do a double lookup - we look in both tag columns in the Filings sheets to make sure we never miss an item and this also allows us to pick up the specific values if we want as well (e.g. the Revenue - Sales line). The names in the 1st column by the way are our names for the items and demonstrate how having an in-between sheet enables you to customise the data before it hits your model.
Subscribe to:
Posts (Atom)