Thursday 7 November 2013

Transparent data - drilling down using XBRL

In my previous posts, I made a big play about the transparency of XBRL and how for example XBRL to XL leverages this. However in reality our application has never fully exploited these possibilities, until now. Yes you could view the “as presented” data used in the standard formula by switching to the relevant filing sheet to see the company's financial statements and notes as laid out in the paper version of the 10-K. But there was no direct link, no instant drill down.

Not only do I think that transparency is essential in a constructing a robust model and critical in ensuring you don't deal on the wrong number, it's also rather thrilling to be magically transported back from a headline figure to it's underlying components, displayed just as the company disclosed them.

The following screen shots don't really do it justice as you kinda need to see it in action so you may want to watch the video instead. The latest XBRL Sheet example, downloadable from here, contains the new "Standard" sheet that enables the top to bottom drill down shown here using the two included macros. The macro code can also be downloaded from there separately as a VBA module (Basically just a text file with the code in).

We have created two simple functions that enable you to rapidly move around the data to gain an understanding of the underlying values, where they came from and to verify their accuracy.


XDrillDown (assigned the short cut key ctrl y in the example sheet) drills down to the next layer of the data. So if you are in the "Model" sheet as in the example above, pressing this short cut will take you the components of the selected ratio. The result of which is shown below.


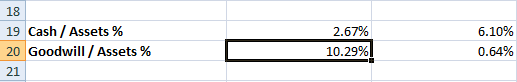
XDrillAcross (short cut key ctrl l - not 1 but the letter as in "level") drills across the same level to show you any of the other components in this layer of the ratio. So pressing the short cut will take you to the other component of "Goodwill/Total Assets" as shown by my arrow. Continually pressing XDrillAcross will cycle through the components in turn so another press will take you back in this case to Goodwill.

If you use XDrillDown on any of these components, it will take you to the next layer (shown below) and reveal where the "Standard" items found these values in the "as reported" XBRL "Filing" sheets downloaded using XBRL Sheet from xbrlxl.com. Now you can see just where these values came from in the 10-K or 10-Q. And again if you use XDrillAcross, it knows where the next component is, so will take you there (as indicated again by my arrow).


This is made possible by a small change we have made to XBRL Sheet. The Standard sheet (see the example above but one with "C69" circled) now has extra columns in it that represent the links to their as reported values.

How do I get back to the different layers? Well each layer is represented by a tab, so just click on the "layer" you want to look at again and the ratio or data item you previously drilled through will still be highlighted.

Just to complete the picture, if you use XDrillDown on a formula which contains a value on the same sheet (e.g. ROCE below), it will reveal every value on the same sheet using arrows (any values on another sheet will be indicated by a dotted line to a "sheet" symbol and can be cycled using XDrillAcross in the usual way). Press XDrillDown again and the arrows will disappear.


It's worth noting these functions can be used to validate any formula with components so could be used for tick back in any spreadsheet you have created with or without XBRL.

These functions aren't doing anything particularly clever, merely packaged up to use existing functionality built into Excel. I'm not big into wheel re-invention. But hopefully they will enable you to take full advantage of the transparency built into XBRL, as implemented by us in XBRL Sheet.

Wednesday 17 July 2013

XBRL Sheet - Direct access to XBRL from within Excel

You may have a read these 2 previous posts Instant Comparisons of XBRL in Excel and Looking up XBRL in Excel so you probably know where I am coming from and with the launch of XBRL Sheet we are getting even closer.

You no longer need to leave the comfort of Excel in order to download reams of XBRL data. Through the wonder of web queries, XBRL Sheet provides instant access to the latest filings for an unlimited number of companies. Want to add an additional company to your model, no problem, just create a new query or better still copy an existing one and change the "Co Id" parameter. Want to load up an older filing, just change the period parameter. See the FAQ's for more information on how to do this.


The example spreadsheet downloadable from here follows the same Model/Standard/XBRL arrangement that allows you to hack the data without disturbing your model (or trash the model without effecting your ability to populate a new one - see Looking up XBRL in Excel).

Now, using web queries, you can ensure that the model is always up to date. Set the external data range option to refresh on opening and if you are using the same period parameter that I've set in the example spreadsheet, it will always download the latest filings on opening.


The other beauty of using web queries is that they can quickly be incorporated into a VBA macro so say you wanted to home in on a particular value or ratio for 100 companies, you could write a VBA Macro using XBRL Sheet to do just that. In fact I ought to knock one up and put it in a future post!

Watch the "How To" video here, download the example spreadsheet here and read the FAQ's here.

And to understand more about web queries, you may want to visit this site. Or if you are using a Mac, try this one.

UPDATE: New video to watch showing how to access 10 years of data in the very latest version and here's the post that goes with it.

Now back to the data issues......

Thursday 2 May 2013

The case against extensions

Thinking again about Daniel Robert's recent post and the virtue of extensions... And shocked to find myself, at the recent International XBRL conference, one of the few to put my hand up in favour of extensions, I thought it might be worth exploring the other extreme - the absence of extensions.

The exclusive use of GAAP tags would give data vendors and wholesale users of data (e.g quants) what they crave - data they can normalize. Of course there are arguments that there is some data that can never be normalized but that won't stop people trying when the goal is to model the world (well maybe an economy or a sector).

So what would be the cost? Would a company's performance suddenly be mis-represented? Would the subtleties of it's economic contribution now become masked?

Isn't that the point of the label (data item description)?

For those who want a more nuanced understanding of a company's business achievements, they merely need to disregard the tags and focus their attention on the labels column. As per Daniel's piece, this applies equally to companies who wish to engage in the art of obfuscation. Isn't this the beauty of XBRL, you have enough data for everyone provided each type is used correctly?

OK so a tag may not fully describe the nature of a data value but the vendors are going to tag it with something anyway. Better that apples are tagged as fruit than risk them being tagged as oranges.

Ultimately this must be advantageous to companies, as rather than the aggregated holes into which their data will fall being decided by a data factory worker on the other side of the world, they get to decide which GAAP tag their precious data will be allocated to.

As James Claus of Moon Capital pointed out at last years US XBRL conference, investors would prefer data which has (if not down right reject data that hasn't) been classified by the companies themselves. And is the reason why Moon capital never use vendor sourced data. Companies need to get precious about their data and XBRL actually allows them to do that.

Monday 15 April 2013

Umm Extensions....picking 3 companies at random

I had a conversation recently with a well regarded member of the XBRL community who intimated to me that serious tagging errors were a thing of the past. Now what you see below may not be errors, but they are a serious problem when attempting to automate analysis using XBRL tagging.

You can find the spreadsheet containing the data I've highlighted on the xbrlxl.com website here.

The examples shown are literally the first 3 companies I loaded up in the XBRL to XL software (off the top of my head - I had no fore-knowledge that they contained significant problems). I expected I might have to look at a dozen or so to find anything remarkable but these 3 large corporations quickly scotched that idea. I should stress these are the very latest 10-K's, not the XBRL they put together when they were first trying to get the hang of this stuff,

I've basically highlighted problems that would effect the kind of analysis I might do if I was interested in understanding the performance of these behemoths of US Industry.


So with Boeing (BA), we can't calculate an accurate figure of trade receivables because any money leant to customers to finance purchases is shown as an extension (no us-gaap tag in the 1st column) so we can't add it to trade receivables automatically, as we might, to get a true figure because they haven't used a standard item to classify it. The extension obscures it's true nature when we want to standardize this data.


If we wanted to calculate our own estimate of EPS on a diluted basis, again we would be out of luck as any numerator we re-calculated could not be divided by the correct denominator as this again has been classified using an extension. Also note that the earnings figure used by the company to calculate basic EPS has been obscured by an extension.


Moving on to inventories, we can't calculate a true work in progress figure, again because of the use of an extension. A significant number in the case of Boeing.


General Motors (GM) is even more problematic. I have no S,G & A or equity income because of extensions. I can't get a figure even for depreciation as the amount has been obscured as a segment axis (don't ask! - but it basically makes it very difficult to get hold of a depreciation number this way because it's hidden behind a segment extension).


So this just leaves us with 3M (MMM). And they've managed to hide trade payables behind an extension.

There are more errors (sorry data issues) - I've just picked out the obvious ones in a cursory flick through these 3 companies.

And it might be there are no suitable us-gaap extensions to cover the item they are trying to disclose.

The use of extensions in the ways highlighted above could be seen by some as healthy and in this respect you might want to read a post by Daniel Roberts.

The data you see in the spreadsheet has all been picked out of sheets generated using XBRL to XL (xbrlxl.com). As well as providing XBRL data for analysis, this version highlights any potential errors.