Friday 6 November 2020

Returning Tagged As Reported XBRL using an API

This is where you can see how a Company Reported their financial data but with tags to allow standardization, comparison and aggregation.

This is available to see in the Beryl Section Sheet. The API call brings back data as seperate records for each year but this is obviously more difficult to read and not how you would see it an report so the Power Query in the example sheet flips the years up onto the y axis of the Table as Columns. This can have the unwanted effect of inserting new columns into the sheet with each new call, as potentially each new column has different name depending on the dates of the years in question coming back from the filing.

To counteract that and to stop it getting messy basically!, we moved the Input Boxes from the top row to the first column. You can have the boxes wherever you want really. This sheet is an example, a starting point. As long as they build valid Queries, they can go wherever makes sense to you. You might want to create a separate opening sheet with all the parameters in for example.


This Call uses the items/section Endpoint to return an As Reported Filing Section.


By choosing the Relative option "123", it will bring back all the primary periods for Report and so will the results will come back looking like the face of the Income Statement if you say choose that Section.


Which section gets returned is determined by which Section you choose. A drop down in the example Section sheet shows you the sections you can choose as denoted by their codes but you can actually view any section that has XBRL Values in the report by selecting it by number. Just visit the Filing Sections sheet see which Sections are available for a filing.


Using an API Call to get an Overview of the XBRL contained in Filing

We have a very simple call that enables you to quickly see which sections of data are available as XBRL in a filing. This is particularly helpful when used in conjunction with items/sections Endpoint. That Endpoint brings back all the XBRL values disclosed in a chosen section along with all the presentational data to display it as it was reported (e.g. show me in the Income Statement for 2019. What you are looking at here when you do that is all the same XBRL used by the SEC to construct their Interactive Data pages for a filing.


Use the Endpoint sections as shown, choose a company in the Co Box and select a Date for the filing. You can also choose further along the row in the Annual? and Quarter Boxes whether you want to see the Annual Filing (e.g. 10-K or 20-F - just select "yr", otherwise "q") or choose which quarter you wish to see the filing for. By default it will bring back the annual filing.


The results, as shown above, give you a list of all the Sections by name and by Tag. Unlike (in theory!), XBRL Values, Sections returned from the SEC data are not tagged, very bizarrely, with a set of standard tags. So we have stepped in to supply our own Standard Section Tags and to make things even easier, especially when summoning a section, we've turned these into a series of short codes. You can see these displayed in the Code column when you a return list of Sections. Each Section is also numbered according to its display order (No). This is useful when summoning a more obscure Section that does not have a Code. Line_Total next to it will give you a handle on whether a Section is likely to contain any useful XBRL (Total lines of XBRL contained in a Section). You can also quickly verify that the data returned for a Section is as it should be by following the "Link" to the same page shown in SEC Interactive Data for a filing. It should be as the data source is the same - the XBRL filed at the SEC.

Thursday 5 November 2020

Getting Tickers and Other Company Details Back with an XBRL API Data Call


There are three relevant Endpoints when trying to find a company to download.

1. cos/try (as shown above) enables you to search on a company name. Input at least five letters into the Company Box and it will return a list if matching companies when you refresh the query (Alt F5) as shown below.

2. cos/ will search by Ticker or CIK to return an exact match. In the case of a Ticker, it may return more than one result as it will show all the different companies that have used that Ticker since Companies have filed XBRL. The most common reason why two companies may have used the same Ticker would be where a company has morphed into a different legal entity so two companies, two CIK's. Don't worry when bringing back results we handle this by mapping the same Ticker to both companies to bring back a seamless series of results. Note: CIK's never change whereas Tickers for a company can.

3. cos/industry. You can use a SIC code with this Endpoint to bring back all companies with the same SIC. You could copy then SIC code for a target company into the industry box, select this Endpoint and the query will return all the companies operating in the same industry.


Wednesday 17 June 2020

XBRL API Quarterly Data Call

As explained in our Getting Started guide, We have set up an Excel sheet to make it really easy to start quickly pulling data back using Beryl, our API. All you have to do is fill in the coloured boxes in any of the sheets and run the query to bring back a time series for your chosen data point.

An API call for quarterly data works in much the same way as for annual values. However to bring back Quarterlies, three more boxes come into play. except this time they are black.

 Black Boxes  - these either represent fixed elements of the API path or ones that have a small set of finite values so we have rigged them up as drop downs in Excel.


 Black Box  - Annual? Default value is "yr" but you can select "q" to see quarterly values instead.

 Black Box  - Quarter. Selecting "q" brings this box into play where you can select which quarter 1,2, or 3. You can also specify "123" to get all quarterlies for a year. NOTE: "12" etc will not bring back 1st and 2nd Quarters. Only "123" works for multiple quarters in a year. If this is set to "4", and the next box is set to "ytd", it will bring back the annual figures.

 Black Box  - YTD. Setting this to "ytd" as opposed to blank will bring back cumulative figures for the year - the Year To Date.

Orange Boxes work just like they do for annual amounts. So if you set the date to 2019, it will bring back the quarter you selected (e.g. 2) for the reporting year ending in that year. And if you set Years to 5, you will get a times series of quarter 2's going back 5 years.

Monday 15 June 2020

Getting started with an XBRL API Data Call

(if you've stumbled across this article and want to know more, email us and I can add you to our beta programme)

We have set up an Excel sheet to make it really easy to start quickly pulling data back using Beryl, our API, or indeed, the XBRL US version.

All you have to do is fill in the coloured boxes in any of the sheets and run the query to bring back a time series for your chosen data point.

For our API you will need a token which you can get from our website by registering or signing in, which then goes in the Red Box.

To run the query, move to a cell in the grey area where the results are. Right click and choose refresh query or use the keyboard shortcut ALT F5. In Excel the API call is made using Power Query.


Green Box - Tag. Choose a data item by entering an XBRL tag. We have constructed a data set of the most commonly used tags that you are likely to need called the X Financials. These are listed on a sheet at the back of the Workbook. If you want to see all the tags you could possibly ever use! then got to an online XBRL Taxonomy (there are quite a few free ones around). I use the Workiva Wdesk Taxonomy Analyser. You can also just enter "All" in this box and it will bring back data for all the items used the companies you select.

Green Box - "All". If you don't know which tag to select or need to get familiar with the tags in use, you can put "All" in the Green Box as the Tag.. Be aware that if a value lies off the main axis (sorry getting a bit technical here), then these values will not get returned with this call. This only applies to more obscure values that might have been disclosed in a more complex table in the notes. A full explanation of axis and dimensions is explained in another article. Values on these axis will be made available in future. We want to make sure we do this in a meaningful way that doesn't bombard you with incomprehensive incomparable data


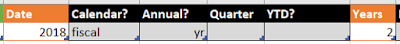
Orange Box - Date. Choose a year for the values that you want returned. It will get values from filings with a reporting period ending in that year. So specifying 20191231 will return values from a 10-K with a year end up to and including that date. If you just enter 2019, it will do the same. If you enter 20190630, it will bring back values for filing periods ending between 20190630 and 20180701.

Orange Box - Years. The other (optional) Orange Box, Years, determines how many years of values are bought back. So the Date box specifies the starting year and Years how many periods are returned in the series. If no Years are specified, it will bring back one year of values.


Blue Box - Cos. Enables you to specify which companies you want values returned for. This is where the beauty of modern Excel kicks in. Add a ticker to the bottom of the list and the Excel Table (The Blue Box) automatically expands to include it. Companies have to be specified by ticker, but don't worry if you haven't got the ticker at hand, you can quickly look them up using our API on the Beryl Cos sheet. You can always reduce the number of companies returned by pulling the Table back up to its original size using the triangular (ish) handle at the bottom right corner of the Table.

Also read - A Walk Around the Results Returned by an API Data Call (coming soon).