I first touched on this in an earlier post and explained what was then our rather clumsy solution to the problem.
Missing totals mean missing standard values when trying to do comparative analysis. They are missing because XBRL preserves the presentation that companies have always used to show their financial performance, namely the succinct and more readable presentation you see in a paper report. Why would you want to repeat a figure just to create a complete set of totals? There's no need, it will only create clutter and make it less readable.
Fortunately we can do something about this and we do in the latest version of XBRL Sheet (the latest version is not yet generally available so email us - jimtruscott@fundamentalx.co.uk - if you would like to start using it). You can find more info on XBRL Sheet in this post and you can watch XBRL Sheet solving the missing totals problem in this video.
Lets have a look at an XBRLSheet download...

Before we used to download one column of tags, now we download two! The 1st column contains the standard tags which is our understanding of the high level tag that the company should be using in a "Standard" rendition of the values. This will usually marry up with the actual tag they used (in column 3) as per line 4 - Cost of Revenue in the example above. But if they have been more specific (which is great as more precise tags gives us a better understanding of their business), then we supply the different high level tag as well (which they haven't used as they would have to duplicate the line, creating a cluttered presentation as discussed above). So line 3 - Revenues is a case in point. Microsoft used the more specific tag "SalesRevenueNet". To make these easy to spot and check if necessary, the different standard tag will appear in a different colour. So we see another one further down. Again we may be interested in quantifying all provisions when a business is restructured rather than just goodwill. These two different tags enable us to do this.
So how do we use this info in our model? Well as we always recommend (see this post - specifically the bit about transparent data), you should connect with this data via an intermediate sheet (see below), to create values that can plug straight into your model.
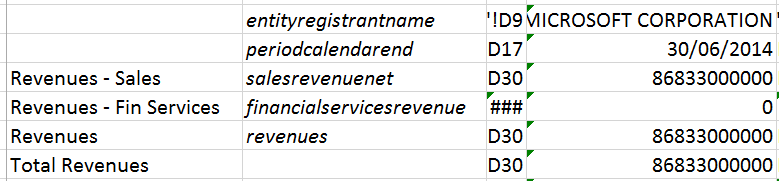
Now with this extra column, we don't need to create a calculation to catch all the multiple alternatives for revenue (as represented by the Total Revenues line); we just need to use a simple lookup on "revenues" in this new column and the values will appear as shown. The 2nd column above contains the tag that is looked for. We in fact do a double lookup - we look in both tag columns in the Filings sheets to make sure we never miss an item and this also allows us to pick up the specific values if we want as well (e.g. the Revenue - Sales line). The names in the 1st column by the way are our names for the items and demonstrate how having an in-between sheet enables you to customise the data before it hits your model.
No comments:
Post a Comment