This SEC Announcment may have slipped your notice, as it was slid out at the back end of last year when certainly my thoughts were more about parties than databases. The SEC announced that some of that mountain of XBRL data that's been piling up on their computers is now available as a series of flat files. The Data Transparency Coalition certainly thought it was significant.
So what are these Structured Data Sets and what does this all mean for accessing Comparative XBRL data for financial analysis? By bulking it up and stripping out the markup they've made part of the XBRL filing data more accessible but with a number of caveats. Note I said "more accessible" and not "accessible". You can't open these files in Excel - you might think you can because they are tab separated flat files but actually you can't; they are too big. They are designed to be read into a database (from whence they come). So if you quickly just want to get hold of some tagged data for a few companies from the SEC, you're out of luck. Note you can also load the XBRL instance document into Excel as XML but that doesn't make it any more readable.
But it is now much easier to read them into an database. Yes you still need to build an intermediary database. But you don't have to worry about context references and dimensions and all that messy XML tagging. e.g. In an existing XBRL filing I might find 43 values for "Revenues" but which is actually the one I want? In the flat file, num.txt, there will probably be just 3 values - one for each of the primary financial periods.
Of course you don't have to build your own database - because we built one earlier! So if you quickly just want to get hold of some tagged data for a few companies then you can! We thought it would be an interesting exercise in evaluating the worth of this pilot program. We found it relatively easy and we like what we see. We chose to add a little pre-processing to the files, to make the resulting database run more efficiently and coalesce better with our existing ones.
Our copy can be accessed in exactly the same way as all our data - through Excel. A simple web query brings the data into a sheet according to the parameters you supply. It works just like the existing XBRL Sheet. The query is available here and the example XBRL Sheet here. You can also find a video here that shows you how to get started with the example sheet. Probably worth pointing out that because access is simply through the rendering of a customisable web page - the web query, access isn't confined to Excel; many other applications and programming languages can interface with this.
So what are the caveats? It is only data from the Financial Statements themselves that are in these files. Nothing from the Notes to Financial Statements for now and new files only appear once a quarter. And it is just as it was filed - there are no corrections in these data sets.
In the next couple of posts I'll talk more about the technical aspects, our implementation and the current limitations of this initiative.
Wednesday, 18 February 2015


Monday, 2 February 2015
Dealing with XBRL data issues part 1 - missing totals
As can be detected from the title, there are numerous issues, many of which in reality are (or can be seen as) positive features of XBRL! I'm gonna deal with each of them one by one by demonstrating the various strategies we use to create comparative data.
I first touched on this in an earlier post and explained what was then our rather clumsy solution to the problem.
Missing totals mean missing standard values when trying to do comparative analysis. They are missing because XBRL preserves the presentation that companies have always used to show their financial performance, namely the succinct and more readable presentation you see in a paper report. Why would you want to repeat a figure just to create a complete set of totals? There's no need, it will only create clutter and make it less readable.
Fortunately we can do something about this and we do in the latest version of XBRL Sheet (the latest version is not yet generally available so email us - jimtruscott@fundamentalx.co.uk - if you would like to start using it). You can find more info on XBRL Sheet in this post and you can watch XBRL Sheet solving the missing totals problem in this video.
Lets have a look at an XBRLSheet download...

Before we used to download one column of tags, now we download two! The 1st column contains the standard tags which is our understanding of the high level tag that the company should be using in a "Standard" rendition of the values. This will usually marry up with the actual tag they used (in column 3) as per line 4 - Cost of Revenue in the example above. But if they have been more specific (which is great as more precise tags gives us a better understanding of their business), then we supply the different high level tag as well (which they haven't used as they would have to duplicate the line, creating a cluttered presentation as discussed above). So line 3 - Revenues is a case in point. Microsoft used the more specific tag "SalesRevenueNet". To make these easy to spot and check if necessary, the different standard tag will appear in a different colour. So we see another one further down. Again we may be interested in quantifying all provisions when a business is restructured rather than just goodwill. These two different tags enable us to do this.
So how do we use this info in our model? Well as we always recommend (see this post - specifically the bit about transparent data), you should connect with this data via an intermediate sheet (see below), to create values that can plug straight into your model.

Now with this extra column, we don't need to create a calculation to catch all the multiple alternatives for revenue (as represented by the Total Revenues line); we just need to use a simple lookup on "revenues" in this new column and the values will appear as shown. The 2nd column above contains the tag that is looked for. We in fact do a double lookup - we look in both tag columns in the Filings sheets to make sure we never miss an item and this also allows us to pick up the specific values if we want as well (e.g. the Revenue - Sales line). The names in the 1st column by the way are our names for the items and demonstrate how having an in-between sheet enables you to customise the data before it hits your model.
I first touched on this in an earlier post and explained what was then our rather clumsy solution to the problem.
Missing totals mean missing standard values when trying to do comparative analysis. They are missing because XBRL preserves the presentation that companies have always used to show their financial performance, namely the succinct and more readable presentation you see in a paper report. Why would you want to repeat a figure just to create a complete set of totals? There's no need, it will only create clutter and make it less readable.
Fortunately we can do something about this and we do in the latest version of XBRL Sheet (the latest version is not yet generally available so email us - jimtruscott@fundamentalx.co.uk - if you would like to start using it). You can find more info on XBRL Sheet in this post and you can watch XBRL Sheet solving the missing totals problem in this video.
Lets have a look at an XBRLSheet download...

Before we used to download one column of tags, now we download two! The 1st column contains the standard tags which is our understanding of the high level tag that the company should be using in a "Standard" rendition of the values. This will usually marry up with the actual tag they used (in column 3) as per line 4 - Cost of Revenue in the example above. But if they have been more specific (which is great as more precise tags gives us a better understanding of their business), then we supply the different high level tag as well (which they haven't used as they would have to duplicate the line, creating a cluttered presentation as discussed above). So line 3 - Revenues is a case in point. Microsoft used the more specific tag "SalesRevenueNet". To make these easy to spot and check if necessary, the different standard tag will appear in a different colour. So we see another one further down. Again we may be interested in quantifying all provisions when a business is restructured rather than just goodwill. These two different tags enable us to do this.
So how do we use this info in our model? Well as we always recommend (see this post - specifically the bit about transparent data), you should connect with this data via an intermediate sheet (see below), to create values that can plug straight into your model.
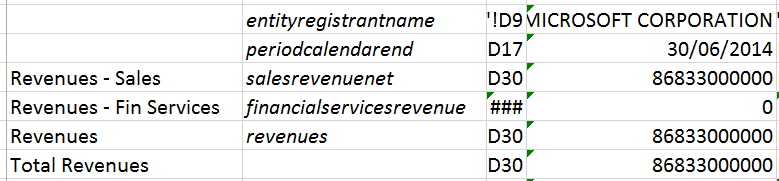
Now with this extra column, we don't need to create a calculation to catch all the multiple alternatives for revenue (as represented by the Total Revenues line); we just need to use a simple lookup on "revenues" in this new column and the values will appear as shown. The 2nd column above contains the tag that is looked for. We in fact do a double lookup - we look in both tag columns in the Filings sheets to make sure we never miss an item and this also allows us to pick up the specific values if we want as well (e.g. the Revenue - Sales line). The names in the 1st column by the way are our names for the items and demonstrate how having an in-between sheet enables you to customise the data before it hits your model.
Friday, 24 January 2014
Fixing errors in XBRL Instance documents again
You can find a previous example in the post "Fixing errors in XBRL Instance documents" and an introduction to XBRL data errors here.
The next example is a little more subtle. Wrong but not immediately obvious, unless you are trying to model some business sectors, perhaps using our Sector3 product! - find loads more info on our award winning product here.
Boeing in their 2012 10-K slightly changed the tag for one of their top level business segments in one of the sections showing data for their businesses. It was referring to exactly the same segment (the label i.e. the description was the same) but the tag was different. A mistake - someone wasn't paying attention. In fact with reference to the previous example, they created an entirely bogus "context" for this identical segment.

So we got rid of it, replacing all connections to it with the correct context reference (shown below). In fact there was more than one wrong context so they all went the same way.

There was a little more work to do here than previously as a tag comes with a panoply of associated data - labels, definitions & the like, all of which we felt it was prudent to remove. Details were as ever recorded in the "xsd" file as shown below.

The consequence of this error was that data was missing for assets in Boeing's Defense, Space And Security business. Well it isn't anymore in Sector3.
The next example is a little more subtle. Wrong but not immediately obvious, unless you are trying to model some business sectors, perhaps using our Sector3 product! - find loads more info on our award winning product here.
Boeing in their 2012 10-K slightly changed the tag for one of their top level business segments in one of the sections showing data for their businesses. It was referring to exactly the same segment (the label i.e. the description was the same) but the tag was different. A mistake - someone wasn't paying attention. In fact with reference to the previous example, they created an entirely bogus "context" for this identical segment.

So we got rid of it, replacing all connections to it with the correct context reference (shown below). In fact there was more than one wrong context so they all went the same way.

There was a little more work to do here than previously as a tag comes with a panoply of associated data - labels, definitions & the like, all of which we felt it was prudent to remove. Details were as ever recorded in the "xsd" file as shown below.

The consequence of this error was that data was missing for assets in Boeing's Defense, Space And Security business. Well it isn't anymore in Sector3.
Thursday, 23 January 2014
Fixing errors in XBRL Instance documents
(Should be read in conjunction with the post – XBRL Data Errors)
In my last post, I talked about the different XBRL errors that you could possibly encounter. And we at Fundamental X are going to fix errors in the first two categrories (XBRL formatting errors & stupid mistakes) whenever we come across them.
This approach suits us as the data we currently output to Excel via XBRL to XL and Sector3 is generated on the fly from the original instance documents filed with the SEC. And we figure there are a lot of people out there who prefer to deal with the original documents rather than data that’s been mangled through a database.
XBRL formatting errors are rare. Stupid mistakes made in the creation of the XBRL filing are not (Invalid Axis Member Combination, one of the XBRL US classifications of this type of mistake, currently sits at the top of the error leader board) so I’m going to focus on these.
The following two examples should give you a flavour of the nature of these errors and how we will fix them.
Texas Capital Bancshares 2012 10-K
If you look at the Document and Entity Information in the interactive data on the SEC site, you immediately see the problem:

The "Document Period End Date" and the axis date don't match. That's because the date for this filing hasn't been updated in the XBRL from what is more than likely a previous XBRL filing (you can double check that the date is indeed incorrect by referencing the html 10-K), Therefore the dates for the most important contexts in the entire filing are wrong. At this point our processing software throws a wobbly and we fix the error in the instance document. Seeing it is an elementary error in the XBRL, it seems judicious to fix it in the source rather than further down the processing and storage road.
Of course this kind of error should be bought to the attention of the SEC and the company concerned. The filing will not be corrected but I think an additional amended 10-K/A would be filed instead. But markets wait for no man.......
So what do we do? Well here is what the error looked like in the XBRL:

So we changed the date in the context (and all other relevant contexts) and corrected the context name to reflect the change. At this point all references to this context also needed to be changed. It's important to note that we didn't re-create the XBRL filing as we want to retain the integrity of the existing filing, so we merely amended it. All changes are noted at the top of the file involved and all file changes are summarised in the xsd file as shown below:

The amended files are then used in preference to those on the SEC site when generating XBRL to XL products.
I feel this post is getting a little tedious so the second example will have to wait till the next post. You can download the amended XBRL instance document for Texas Capital Bancshares in it's entirety from here.
In my last post, I talked about the different XBRL errors that you could possibly encounter. And we at Fundamental X are going to fix errors in the first two categrories (XBRL formatting errors & stupid mistakes) whenever we come across them.
This approach suits us as the data we currently output to Excel via XBRL to XL and Sector3 is generated on the fly from the original instance documents filed with the SEC. And we figure there are a lot of people out there who prefer to deal with the original documents rather than data that’s been mangled through a database.
XBRL formatting errors are rare. Stupid mistakes made in the creation of the XBRL filing are not (Invalid Axis Member Combination, one of the XBRL US classifications of this type of mistake, currently sits at the top of the error leader board) so I’m going to focus on these.
The following two examples should give you a flavour of the nature of these errors and how we will fix them.
Texas Capital Bancshares 2012 10-K
If you look at the Document and Entity Information in the interactive data on the SEC site, you immediately see the problem:

The "Document Period End Date" and the axis date don't match. That's because the date for this filing hasn't been updated in the XBRL from what is more than likely a previous XBRL filing (you can double check that the date is indeed incorrect by referencing the html 10-K), Therefore the dates for the most important contexts in the entire filing are wrong. At this point our processing software throws a wobbly and we fix the error in the instance document. Seeing it is an elementary error in the XBRL, it seems judicious to fix it in the source rather than further down the processing and storage road.
Of course this kind of error should be bought to the attention of the SEC and the company concerned. The filing will not be corrected but I think an additional amended 10-K/A would be filed instead. But markets wait for no man.......
So what do we do? Well here is what the error looked like in the XBRL:

So we changed the date in the context (and all other relevant contexts) and corrected the context name to reflect the change. At this point all references to this context also needed to be changed. It's important to note that we didn't re-create the XBRL filing as we want to retain the integrity of the existing filing, so we merely amended it. All changes are noted at the top of the file involved and all file changes are summarised in the xsd file as shown below:

The amended files are then used in preference to those on the SEC site when generating XBRL to XL products.
I feel this post is getting a little tedious so the second example will have to wait till the next post. You can download the amended XBRL instance document for Texas Capital Bancshares in it's entirety from here.
XBRL data errors
I’m going to talk here about actual errors rather than data issues (a whole different topic worthy of a ream of posts by itself). So we are talking here about stuff that is just plain wrong (rather than data that just might need some proper treatment).
XBRL US, to their credit, monitor this all very carefully and clinically. They have divided errors up into 32 types (If we've got a 16,000 plus data set, better make sure we have a similarly impressive number of error types to go with it!).
I guess though I would classify all these errors into four categories:
Errors in the XBRL formatting – you should never see these as the filing would fail the compliance tests on submission although according to the XBRL US stats they do exist - "Filing is Invalid XBRL" in the link above.
Stupid mistakes – often made because the filer quite understandably uses the last filing as a template e.g. period date is wrong.
Erroneous values – seeing the figures are more often than not pasted or automatically transposed from the html filing (this believe it or not is how most XBRL filings are created!!), the absolute values shouldn’t be wrong but the sign or scaling factor could be.
Incorrect or questionable tagging – could either be down to the wrong US GAAP tag being used or the inappropriate use of an extension.
There are various financial data providers out there who can and will fix this type of error in their databases but if like me you prefer to deal with the original documents then what to do?
Well we’ve decided to fix some of these errors in the instance documents themselves. The next post will explain exactly what we are talking about here, by way of a couple of examples.
XBRL US, to their credit, monitor this all very carefully and clinically. They have divided errors up into 32 types (If we've got a 16,000 plus data set, better make sure we have a similarly impressive number of error types to go with it!).
I guess though I would classify all these errors into four categories:
Errors in the XBRL formatting – you should never see these as the filing would fail the compliance tests on submission although according to the XBRL US stats they do exist - "Filing is Invalid XBRL" in the link above.
Stupid mistakes – often made because the filer quite understandably uses the last filing as a template e.g. period date is wrong.
Erroneous values – seeing the figures are more often than not pasted or automatically transposed from the html filing (this believe it or not is how most XBRL filings are created!!), the absolute values shouldn’t be wrong but the sign or scaling factor could be.
Incorrect or questionable tagging – could either be down to the wrong US GAAP tag being used or the inappropriate use of an extension.
There are various financial data providers out there who can and will fix this type of error in their databases but if like me you prefer to deal with the original documents then what to do?
Well we’ve decided to fix some of these errors in the instance documents themselves. The next post will explain exactly what we are talking about here, by way of a couple of examples.
Thursday, 7 November 2013
Transparent data - drilling down using XBRL
In my previous posts, I made a big play about the transparency of XBRL and how for example XBRL to XL leverages this. However in reality our application has never fully exploited these possibilities, until now. Yes you could view the “as presented” data used in the standard formula by switching to the relevant filing sheet to see the company's financial statements and notes as laid out in the paper version of the 10-K. But there was no direct link, no instant drill down.
Not only do I think that transparency is essential in a constructing a robust model and critical in ensuring you don't deal on the wrong number, it's also rather thrilling to be magically transported back from a headline figure to it's underlying components, displayed just as the company disclosed them.
The following screen shots don't really do it justice as you kinda need to see it in action so you may want to watch the video instead. The latest XBRL Sheet example, downloadable from here, contains the new "Standard" sheet that enables the top to bottom drill down shown here using the two included macros. The macro code can also be downloaded from there separately as a VBA module (Basically just a text file with the code in).
We have created two simple functions that enable you to rapidly move around the data to gain an understanding of the underlying values, where they came from and to verify their accuracy.

XDrillDown (assigned the short cut key ctrl y in the example sheet) drills down to the next layer of the data. So if you are in the "Model" sheet as in the example above, pressing this short cut will take you the components of the selected ratio. The result of which is shown below.

XDrillAcross (short cut key ctrl l - not 1 but the letter as in "level") drills across the same level to show you any of the other components in this layer of the ratio. So pressing the short cut will take you to the other component of "Goodwill/Total Assets" as shown by my arrow. Continually pressing XDrillAcross will cycle through the components in turn so another press will take you back in this case to Goodwill.
If you use XDrillDown on any of these components, it will take you to the next layer (shown below) and reveal where the "Standard" items found these values in the "as reported" XBRL "Filing" sheets downloaded using XBRL Sheet from xbrlxl.com. Now you can see just where these values came from in the 10-K or 10-Q. And again if you use XDrillAcross, it knows where the next component is, so will take you there (as indicated again by my arrow).

This is made possible by a small change we have made to XBRL Sheet. The Standard sheet (see the example above but one with "C69" circled) now has extra columns in it that represent the links to their as reported values.
How do I get back to the different layers? Well each layer is represented by a tab, so just click on the "layer" you want to look at again and the ratio or data item you previously drilled through will still be highlighted.
Just to complete the picture, if you use XDrillDown on a formula which contains a value on the same sheet (e.g. ROCE below), it will reveal every value on the same sheet using arrows (any values on another sheet will be indicated by a dotted line to a "sheet" symbol and can be cycled using XDrillAcross in the usual way). Press XDrillDown again and the arrows will disappear.

It's worth noting these functions can be used to validate any formula with components so could be used for tick back in any spreadsheet you have created with or without XBRL.
These functions aren't doing anything particularly clever, merely packaged up to use existing functionality built into Excel. I'm not big into wheel re-invention. But hopefully they will enable you to take full advantage of the transparency built into XBRL, as implemented by us in XBRL Sheet.
Not only do I think that transparency is essential in a constructing a robust model and critical in ensuring you don't deal on the wrong number, it's also rather thrilling to be magically transported back from a headline figure to it's underlying components, displayed just as the company disclosed them.
The following screen shots don't really do it justice as you kinda need to see it in action so you may want to watch the video instead. The latest XBRL Sheet example, downloadable from here, contains the new "Standard" sheet that enables the top to bottom drill down shown here using the two included macros. The macro code can also be downloaded from there separately as a VBA module (Basically just a text file with the code in).
We have created two simple functions that enable you to rapidly move around the data to gain an understanding of the underlying values, where they came from and to verify their accuracy.

XDrillDown (assigned the short cut key ctrl y in the example sheet) drills down to the next layer of the data. So if you are in the "Model" sheet as in the example above, pressing this short cut will take you the components of the selected ratio. The result of which is shown below.

XDrillAcross (short cut key ctrl l - not 1 but the letter as in "level") drills across the same level to show you any of the other components in this layer of the ratio. So pressing the short cut will take you to the other component of "Goodwill/Total Assets" as shown by my arrow. Continually pressing XDrillAcross will cycle through the components in turn so another press will take you back in this case to Goodwill.
If you use XDrillDown on any of these components, it will take you to the next layer (shown below) and reveal where the "Standard" items found these values in the "as reported" XBRL "Filing" sheets downloaded using XBRL Sheet from xbrlxl.com. Now you can see just where these values came from in the 10-K or 10-Q. And again if you use XDrillAcross, it knows where the next component is, so will take you there (as indicated again by my arrow).

This is made possible by a small change we have made to XBRL Sheet. The Standard sheet (see the example above but one with "C69" circled) now has extra columns in it that represent the links to their as reported values.
How do I get back to the different layers? Well each layer is represented by a tab, so just click on the "layer" you want to look at again and the ratio or data item you previously drilled through will still be highlighted.
Just to complete the picture, if you use XDrillDown on a formula which contains a value on the same sheet (e.g. ROCE below), it will reveal every value on the same sheet using arrows (any values on another sheet will be indicated by a dotted line to a "sheet" symbol and can be cycled using XDrillAcross in the usual way). Press XDrillDown again and the arrows will disappear.

It's worth noting these functions can be used to validate any formula with components so could be used for tick back in any spreadsheet you have created with or without XBRL.
These functions aren't doing anything particularly clever, merely packaged up to use existing functionality built into Excel. I'm not big into wheel re-invention. But hopefully they will enable you to take full advantage of the transparency built into XBRL, as implemented by us in XBRL Sheet.
Wednesday, 17 July 2013
XBRL Sheet - Direct access to XBRL from within Excel
You may have a read these 2 previous posts Instant Comparisons of XBRL in Excel and Looking up XBRL in Excel so you probably know where I am coming from and with the launch of XBRL Sheet we are getting even closer.
You no longer need to leave the comfort of Excel in order to download reams of XBRL data. Through the wonder of web queries, XBRL Sheet provides instant access to the latest filings for an unlimited number of companies. Want to add an additional company to your model, no problem, just create a new query or better still copy an existing one and change the "Co Id" parameter. Want to load up an older filing, just change the period parameter. See the FAQ's for more information on how to do this.

The example spreadsheet downloadable from here follows the same Model/Standard/XBRL arrangement that allows you to hack the data without disturbing your model (or trash the model without effecting your ability to populate a new one - see Looking up XBRL in Excel).
Now, using web queries, you can ensure that the model is always up to date. Set the external data range option to refresh on opening and if you are using the same period parameter that I've set in the example spreadsheet, it will always download the latest filings on opening.

The other beauty of using web queries is that they can quickly be incorporated into a VBA macro so say you wanted to home in on a particular value or ratio for 100 companies, you could write a VBA Macro using XBRL Sheet to do just that. In fact I ought to knock one up and put it in a future post!
Watch the "How To" video here, download the example spreadsheet here and read the FAQ's here.
And to understand more about web queries, you may want to visit this site. Or if you are using a Mac, try this one.
UPDATE: New video to watch showing how to access 10 years of data in the very latest version and here's the post that goes with it.
Now back to the data issues......
You no longer need to leave the comfort of Excel in order to download reams of XBRL data. Through the wonder of web queries, XBRL Sheet provides instant access to the latest filings for an unlimited number of companies. Want to add an additional company to your model, no problem, just create a new query or better still copy an existing one and change the "Co Id" parameter. Want to load up an older filing, just change the period parameter. See the FAQ's for more information on how to do this.

The example spreadsheet downloadable from here follows the same Model/Standard/XBRL arrangement that allows you to hack the data without disturbing your model (or trash the model without effecting your ability to populate a new one - see Looking up XBRL in Excel).
Now, using web queries, you can ensure that the model is always up to date. Set the external data range option to refresh on opening and if you are using the same period parameter that I've set in the example spreadsheet, it will always download the latest filings on opening.

The other beauty of using web queries is that they can quickly be incorporated into a VBA macro so say you wanted to home in on a particular value or ratio for 100 companies, you could write a VBA Macro using XBRL Sheet to do just that. In fact I ought to knock one up and put it in a future post!
Watch the "How To" video here, download the example spreadsheet here and read the FAQ's here.
And to understand more about web queries, you may want to visit this site. Or if you are using a Mac, try this one.
UPDATE: New video to watch showing how to access 10 years of data in the very latest version and here's the post that goes with it.
Now back to the data issues......
Subscribe to:
Posts (Atom)